Apparent Temperature
is the perceived temperature derived from either a combination of temperature and wind (Wind Chill) or temperature and humidity (Heat Index) for the indicated hour. When the temperature at a particular grid point falls to 50 F or less, wind chill will be used for that point for the Apparent Temperature. When the temperature at a grid point rises above 80 F, the heat index will be used for Apparent Temperature. Between 51 and 80 F, the Apparent Temperature will be the ambient air temperature.
Ceiling
is the height of the lowest cloud layer that contributes at least five oktas to the total sky cover.
Convective Hazard Outlook
is a categorical forecast (marginal, slight, enhanced, moderate, or high risk) that specifies the perceived level of threat of thunderstorms, severe thunderstorms, hail, damaging winds, and tornadoes.
Critical Fire Weather
delineates areas where pre-existing fuel conditions, combined with forecast weather conditions will result in a significant threat for wildfires. Two types of areas are specified: critical fire weather areas for wind and relative humidity, and extremely critical fire weather areas for extreme conditions of wind and relative humidity.
Damaging Thunderstorm Wind Probability
is the probability (in percent) of winds greater than 58 miles per hour occurring within 25 miles of any point during the outlook period. The higher the probability, the higher the threat of severe thunderstorm winds occurring.
Dew Point
is the expected dew point temperature for the indicated hour. Dew point temperature is a measure of atmospheric moisture. It is the temperature to which air must be cooled in order to reach saturation (assuming air pressure and moisture content are constant).
Dry Thunderstorms
delineates areas expecting widespread or numerous thunderstorms that produce little wetting rain (<0.10 in) where dried fuels exist.
Extreme Hail Probability
is the probability (in percent) of hail greater than 2 inches in diameter within 25 miles of any point during the outlook period. The higher the probability, the higher the threat of extreme hail occurring.
Extreme Thunderstorm Wind Probability
is the probability (in percent) of winds greater than 75 miles per hour occurring within 25 miles of any point during the outlook period. The higher the probability, the higher the threat of extreme thunderstorm winds occurring.
Extreme Tornado Probability
is the probability (in percent) of Enhanced Fujita scale 2 (EF2) tornadoes occurring within 25 miles of any point during the outlook period. The higher the probability, the higher the threat of extreme tornadoes.
Forecast of Reference Crop Evapotranspiration (FRET)
is the expected depth of water that would evaporate and transpire from a reference crop under the forecast weather conditions on a daily and weekly basis over the next 7 days. The FRET is for short crops with an approximate height of 12 cm similar to full cover grasses.
Hail Probability
is the probability (in percent) of hail greater than three-quarters of an inch in diameter (size of a penny) occurring within 25 miles of any point during the outlook period. The higher the probability, the higher the threat of severe hail.
Hazards
are weather or hydrologic hazardous events issued for the protection of life and property and the enhancement of the national economy. The hazards grid includes long duration coastal, marine, non-precipitation, tropical, convective, winter weather and some hydrological hazards. It does not include some short duration watches and warnings such as Tornado, Severe Thunderstorm, Flash Flood, Gale, and Special Marine Warnings. See the latest Hazards Product Description Document at:
https://nws.weather.gov/products/PDD/HazardsGrid.pdf for the latest listing of included hazards and definitions.
National Forecast Digital Database
Watch, Warning, & Advisory Legend
| Color |
Label |
Hazard / Weather Event |
| |
|
None |
| |
Wind |
|
|
LW.Y, WI.Y |
Lake Wind Advisory, Wind Advisory |
|
HW.A |
High Wind Watch |
|
HW.W |
High Wind Warning |
| |
Flood |
|
|
FF.A |
Flash Flood Watch |
|
CF.Y, LS.Y |
Coastal Flood Advisory, Lakeshore Flood Advisory |
|
CF.A, LS.A |
Coastal Flood Watch, Lakeshore Flood Watch |
|
CF.W, LS.W |
Coastal Flood Warning, Lakeshore Flood Warning |
|
FA.A |
Flood Watch (Area) |
|
FL.Y, FA.Y |
Flood Advisory (Point), Flood Advisory |
| |
Thunderstorm |
|
|
SV.A |
Severe Thunderstorm Watch |
| |
Tornado |
|
|
TO.A |
Tornado Watch |
| |
Tropical |
|
|
SS.A |
Storm Surge Watch |
|
SS.W |
Storm Surge Warning |
|
SS.A |
Hurricane Wind Watch |
|
SS.W |
Hurricane Wind Warning |
|
HU.A, TY.A |
Hurricane Watch, Typhoon Watch |
|
HU.W, TY.W |
Hurricane Warning, Typhoon Warning |
|
TI.A, TR.A |
Tropical Storm Wind Watch, Tropical Storm Watch |
|
TI.W, TR.W |
Tropical Storm Wind Warning, Tropical Storm Warning |
| |
Marine |
|
|
HF.A |
Hurricane Force Wind Watch |
|
HF.W |
Hurricane Force Wind Warning |
|
SR.A |
Storm Watch |
|
SR.W |
Storm Warning |
|
GL.A |
Gale Watch |
|
GL.W |
Gale Warning |
|
SU.Y |
High Surf Advisory |
|
SU.W |
High Surf Warning |
|
SW.Y, RB.Y, SI.Y, SC.Y |
Small Craft Advisory |
|
SE.A |
Hazardous Seas Watch |
|
SE.W |
Hazardous Seas Warning |
|
UP.Y |
Freezing Spray Advisory |
|
UP.A |
Heavy Freezing Spray Watch |
|
UP.W |
Heavy Freezing Spray Warning |
|
BW.Y |
Brisk Wind Advisory |
|
LO.Y |
Low Water Advisory |
|
BH.S, RP.S |
Beach Hazard Statement, Rip Current Statement |
| |
Winter Weather |
|
|
WW.Y |
Winter Weather Advisory |
|
WS.A |
Winter Storm Watch |
|
WS.W |
Winter Storm Warning |
| |
Snow |
|
|
LE.A |
Lake Effect Snow Watch |
|
LE.W |
Lake Effect Snow Warning |
|
LE.Y, LB.Y |
Lake Effect Snow Advisory, Lake Effect & Blowing Snow Advisory |
| |
Blizzard |
|
|
BZ.A |
Blizzard Watch |
|
BZ.W |
Blizzard Warning |
| |
Ice |
|
|
IS.W |
Ice Storm Warning |
|
ZR.Y |
Freezing Rain Advisory |
|
ZF.Y |
Freezing Fog Advisory |
| |
Cold |
|
|
WC.Y |
Wind Chill Advisory |
|
WC.A |
Wind Chill Watch |
|
WC.W |
Wind Chill Warning |
|
EC.A, EC.W |
Extreme Cold Watch, Extreme Cold Warning |
|
FR.Y |
Frost Advisory |
|
FZ.A |
Freeze Watch |
|
FZ.W |
Freeze Warning |
|
HZ.A |
Hard Freeze Watch |
|
HZ.W |
Hard Freeze Warning |
| |
Heat |
|
|
HT.Y |
Heat Advisory |
|
EH.A |
Excessive Heat Watch |
|
EH.W |
Excesssive Heat Warning |
| |
Miscellaneous |
|
|
FW.A |
Fire Weather Watch |
|
FW.W |
Red Flag Warning |
|
DU.Y |
Blowing Dust Advisory |
|
SM.Y |
Dense Smoke Advisory |
|
DS.W |
Dust Storm Warning |
|
FG.Y |
Dense Fog Advisory |
|
AS.Y |
Air Stagnation Advisory |
|
AF.Y |
Ashfall Advisory |
|
AF.W |
Ashfall Warning |
HeatRisk (Experimental)
is a color-numeric-based index that uses high-resolution weather, climate, and Centers for Disease Control and Prevention (CDC) heat-health data to place the upcoming temperature forecast into climatological context and identifies potentially dangerous heat that will lead to increased heat-related impacts. It takes into account how significantly above normal the high and low temperatures are, the time of the year, the duration of the unusual heat, if there is overnight relief, and if temperatures are at high enough levels to pose an elevated risk for heat complications based on CDC heat-health thresholds.
| |
Risk of Heat-Related Impacts |
0 |
Little to no risk from expected heat. |
1 |
Minor - This level of heat affects primarily those individuals extremely sensitive to heat, especially when outdoors without effective cooling and/or adequate hydration. |
2 |
Moderate - This level of heat affects most individuals sensitive to heat, especially those without effective cooling and/or adequate hydration. Impacts possible in some health systems and in heat-sensitive industries. |
3 |
Major = This level of heat affects anyone without effective cooling and/or adequate hydration. Impacts likely in some health systems, heat-sensitive industries and infrastructure. |
4 |
Extreme = This level of rare and/or long-duration extreme heat with little to no overnight relief affects anyone without effective cooling and/or adequate hydration. Impacts likely in most health systems, heat-sensitive industries and infrastructure. |
Hurricane Threats
are the worst-case plausible scenario or threat associated with each of four tropical cyclone hazards: wind, storm surge, flooding rain, and tornadoes.
Threats take into account the forecast magnitude and the associated forecast uncertainty of the hazard.
There are four significant levels which describe each threat grid and are described in the tables below:
| |
Wind Threat |
|
Potential for wind greater than 110 mph |
|
|
Potential for wind 74 to 110 mph |
|
Potential for wind 58 to 73 mph |
|
Potential for wind 39 to 57 mph |
| |
Storm Surge Threat |
|
Potential for storm surge > 9 ft above ground |
|
Potential for storm surge > 6 ft above ground |
|
Potential for storm surge > 3 ft above ground |
|
Potential for storm surge > 1 ft above ground |
| |
Flooding Rain Threat |
|
Potential for extreme flooding rain |
|
Potential for major flooding rain |
|
Potential for moderate flooding rain |
|
Potential for localized flooding rain |
| |
Tornado Threat |
|
Potential for an outbreak of tornadoes |
|
Potential for many tornadoes |
|
Potential for several tornadoes |
|
Potential for a few tornadoes |
Threats are valid whenever tropical cyclone watches and warnings are in effect along the Atlantic and Gulf Coasts, as well as Puerto Rico.
They convey the threat for the duration of the event, not specific timing. See the latest Tropical Cyclone Threats Product Description Document at:
https://nws.weather.gov/products/PDD/PDD_HTI_grids_2018-04-09.pdf for the listing and description of the included threats.
Ice Accumulation
is the expected thickness of new ice accumulation upon an elevated horizontal flat surface (in hundredths of inches) during a six-hour period.
Low Level Wind Shear
is the speed and direction of the wind at the height (above ground) of top of the low-level wind shear layer.
Maximum/Minimum Temperature
is the daytime maximum or the overnight minimum temperature.
Maximum/Minimum Relative Humidity
is the highest or lowest relative humidity (%) expected for the indicated 12-hour period.
Precipitation Amount
is the expected quantity of liquid precipitation accumulated over a six hourly period. A quantitative precipitation forecast (QPF) will be specified when a measurable ( 1/100th of an inch or more) precipitation type is forecast for any hour during a QPF valid period. NDFD valid periods for QPF are 6 hours long beginning and ending at 0000, 0600, 1200 and 1800 UTC. QPF includes the liquid equivalent amount for snow and ice.
Probability of Precipitation (PoP12)
is the likelihood, expressed as a percent, of a measurable precipitation event (1/100th of an inch or more) at a grid point during the 12-hour valid period. The 12-hour valid periods begin and end at 0000 and 1200 Coordinated Universal Time (UTC).
Precipitation Potential Index (PPI)
is a means to show confidence as to the location of precipitation at each forecast time across the forecast area. PPI values range from 0 to 100 and resemble PoP12 values in magnitude. The PoP12 for any 12- hour period can be derived by taking the maximum PPI value within the desired period.
Relative Humidity
is a ratio, expressed as a percent, of the amount of atmospheric moisture present relative to the amount that would be present if the air were saturated. Since the latter amount is dependent on temperature, relative humidity is a function of both moisture content and temperature.
Sky Cover
is the expected amount of opaque clouds (in percent) covering the sky valid for the indicated hour.
Snow Amount
is the expected total accumulation of new snow during a 6 hour period. A snow accumulation grid will be specified whenever a measurable snowfall is forecast for any hour during a valid period. Valid periods for the NDFD begin and end at 0600, 1200, 1800, and 0000 UTC.
Snowfall high end
indicates there's a 1 in 10 chance (10%) of higher snowfall during the specified 24-hour, 48-hour, or 72-hour period.
Snowfall low end
indicates there's a 9 in 10 chance (90%) of higher snowfall during the specified 24-hour, 48-hour, or 72-hour period.
Snow Level
is the lowest elevation in feet/meters at which precipitation is expected to be snow for the indicated hour.
Snow or Sleet > 0.25in Liquid Equivalent Probabilty (in percent)
is the Weather Prediction Center's Day 4-7 Winter Weather Outlook probabilistic forecast depicting the probability of winter precipitation (snow/sleet) exceeding 0.25 inches (~6 mm) water equivalent over a 24-hour period.
Snow to Liquid Ratio
is the ratio of snow accumulation to its melted liquid equivalent for the indicated 6-hour period.
Temperature
is the expected temperature valid for the indicated hour.
Tornado Probability
is the probability (in percent) of a tornado occurring within 25 miles of any point during the outlook period. The higher the probability, the higher the threat of tornadoes occurring.
Total New Ice
is the sum of all forecast six hourly ice accumulations prior to the indicated hour.
Total New Precipitation
is the sum of all forecast six hourly liquid precipitation amounts prior to the indicated hour. This total includes the liquid equivalent amount for snow and ice.
Total New Snow
is the sum of all forecast six hourly snow amounts prior to the indicated hour.
Total Probability of Extreme Severe Thunderstorms
is the probability in percent of EF2 (Enhanced Fujita scale 2) tornadoes, damaging winds with speeds greater than 75 miles per hour, or large hail two inches or greater in diameter occurring within 25 miles of any point during the outlook period.
Total Probability of Severe Thunderstorms
is the probability in percent of tornadoes, damaging winds with speeds greater than 58 miles per hour, or large hail three quarters of an inch in diameter (penny-size) occurring within 25 miles of any point during the outlook period.
Tropical Cyclone Surface Wind Speed Probability (Cumulative)
is the probability (in percent) of sustained surface wind speed greater than 34-, 50- and 64-knots (3 separate elements) sometime during the specified cumulative forecast period (0 - 6 hours, 0-12, 0-18, etc.) at each specific point. NOTE: This element is provided for coastal and inland points as well as offshore locations (e.g., buoys).
Tropical Cyclone Surface Wind Speed Probability (Incremental)
is the probability (in percent) of sustained surface wind speed greater than 34-, 50-, and 64-knots (3 separate elements) sometime during the specified forecast period (0 - 6 hours, 6 -12, 12 -18, etc.) at each specific point. These values are incremental since they can increase in value by accounting for the possibility the event might start in an earlier period and still be occurring in the specified period. NOTE: This element is provided for coastal and inland points as well as offshore locations (e.g., buoys).
Visibility
is the distance at which a given standard object can be seen and identified with the unaided eye.
Wave Height
is the average height (from trough to crest) of the one-third highest waves valid for the top of the designated hour. Wave Height is a combination of wind waves and swell.
Weather
is the expected weather (precipitating or non-precipitating) valid at the indicated hour. Precipitating weather includes type, probability, and intensity information. In cases of convective weather, coverage may be substituted for probability.
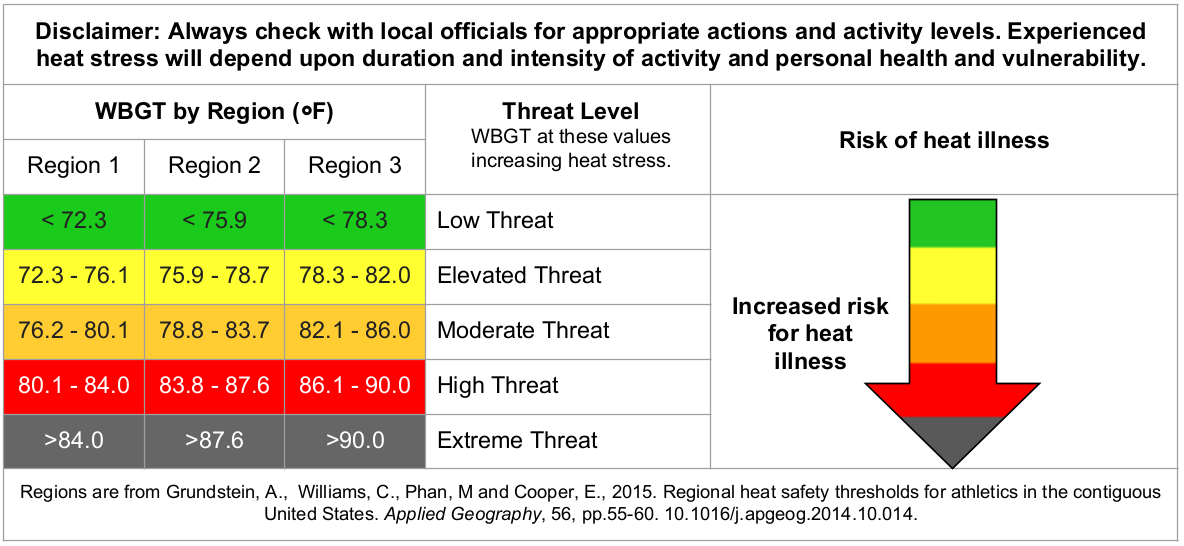
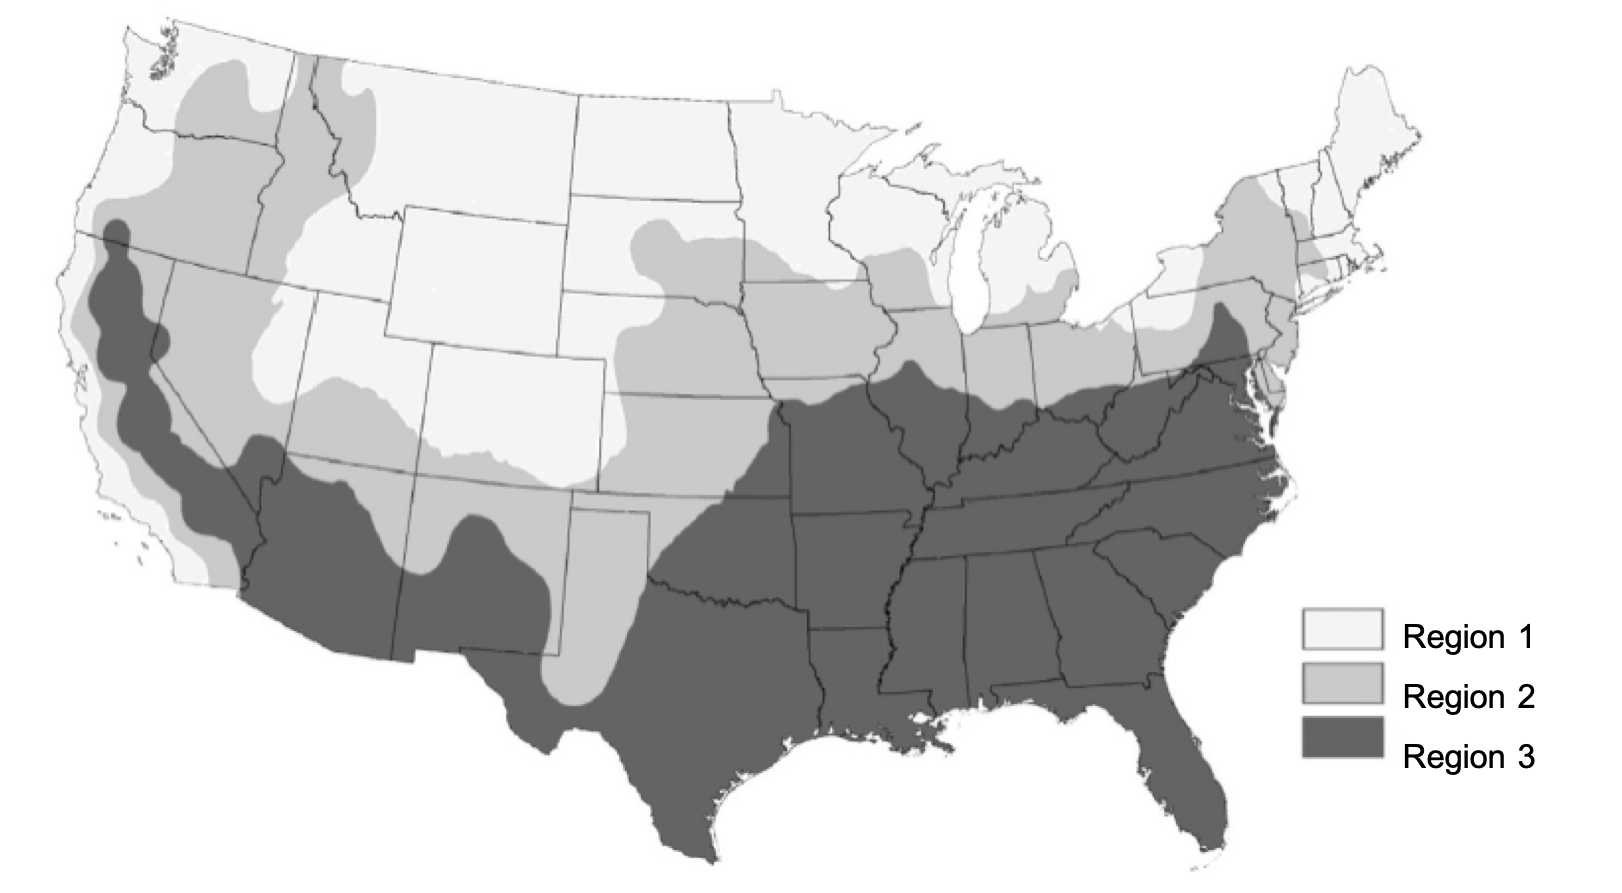
Wet Bulb Globe Temperature
is an indication of expected heat stress in direct sunlight, which takes into account: temperature, humidity, wind speed, sun angle and cloud cover (solar radiation). This differs from the heat index, or apparent temperature, which takes into consideration temperature and humidity and is calculated for shady areas. If you work or exercise in direct sunlight, the wet bulb globe temperature is a good element to monitor. The depicted heat stress categories associated with wet bulb globe forecast values vary by region to account for geographic variations in heat exposure and acclimatization.
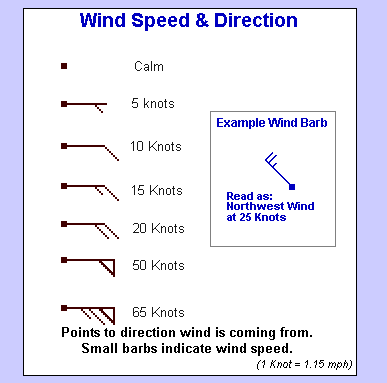
Wind Direction & Speed
Wind direction is the expected sustained 10-meter wind direction for the indicated hour, using 36 points of a compass. Wind Speed is the expected sustained 10-meter sustained wind speed for the indicated hour. Wind barbs (shown below) are used to denote wind speed and direction.
Wind Gust
is the maximum 3-second wind speed forecast to occur within a 2-minute interval at a height of 10 meters. Wind gust forecasts are valid at the top of the indicated hour.


 Follow us on YouTube